官方文档 官方文档
环形饼图
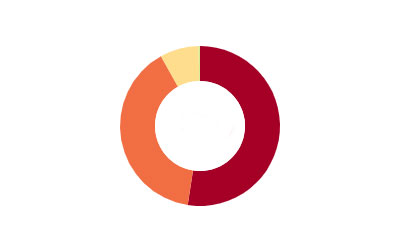
- 交互:鼠标放上去饼图部分变大。
- 颜色部分用 interpolateRdYlGn
有许多颜色可用 具体看 d3 color
1 |
|
树形图
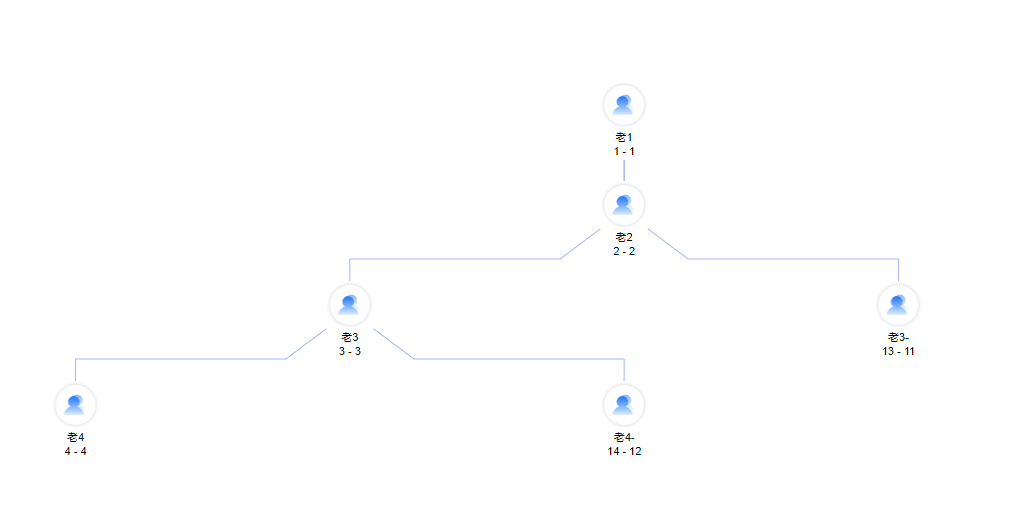
1 | // 把数据 转为层次结构数据: |
中国地图
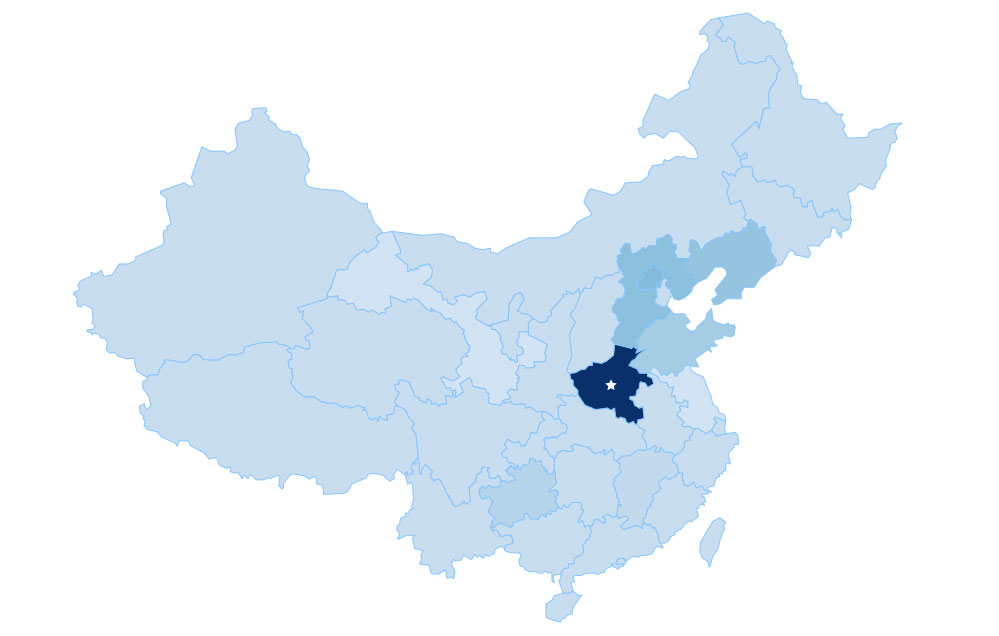
地图需要传入地图经纬度数据。中国地图经纬度数据
1 | // data = china.map.json |
渐变图例
- color渐变 d3.interpolateBlues
- defs linearGradient 做渐变背景

1 | let defs = this.svg.append("defs"); |
其他
- 已经半径,角度,求中心点。
1
2
3
4
5
6
function getRoundPoint(r, angle) {
return [
r * Math.cos(angle),
r * Math.sin(angle)
]
}